Loudness Chart

|
Loudness Chart |
||
| |
||
| Move the mouse accross the display elements to get the corresponding descriptions.. | ||
|
||
| |
||
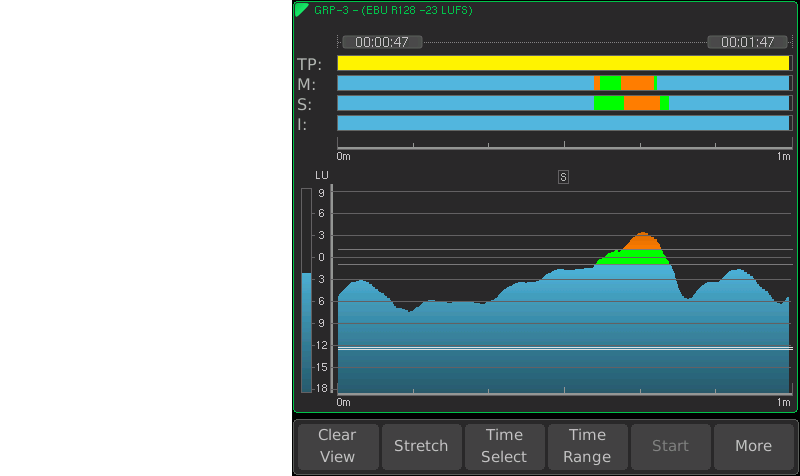
| In the combination of the example you can easily detect the range the shortterm value is mainly moving across (S graph drawn over time) and that the S value is shortly exceeding the target level. You can also estimate that their are currently no parts being excluded from the measurement by the Relative Gate (no curve progression below the doubled line). But the program shown in the example could slightly be increased to get the I value into the green range. | ||