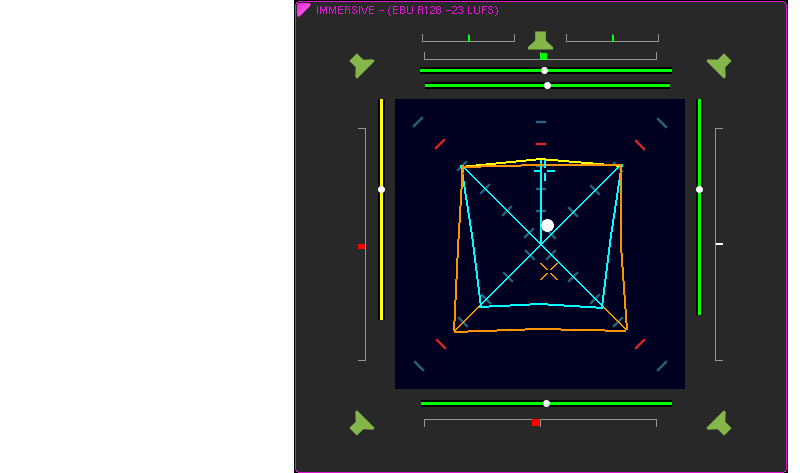
ISA - Immersive Sound Analyzer
Move the mouse accross the display elements to get the corresponding descriptions.

The cyan lines, whose ends move on the axes and form a rectangle depending on the level in the individual channels, represent the total volume of the Main Bed (middle layer) of the immersive format, the orange-colored lines the total volume of the Upper Bed (upper layer).
An important element is the Immersive Dominance Indicator, which as a white dot represents the relationship between the two levels and shows the position and height of the entire signal. If the dot is larger and closer to the orange X (Dominance Indicator of the Upper Bed), the subjectively perceived spatial focal point is more in the Upper Bed. If the dot is smaller and closer to the cyan + (Dominance Indicator of the Main Bed), the focal point is more in the Main Bed.
Further information and examples about reading the graphical display provides the interactive demonstration of the elements of SSA.